
Executive Briefing: Eliminating Cloud ERP Latency & Database Contention
- Cloud SaaS Resource Governance: In Microsoft Business Central SaaS, hardware cannot simply be scaled up. Elastic compute governors throttle unindexed AL queries and terminate long-running transactions to protect multi-tenant infrastructure.
- SQL Lock Elimination: Over 70% of table lock timeouts stem from extended transaction windows in AL—holding exclusive locks while calling external web services or presenting modal user dialogs.
- Job Queue Category Isolation: Default single-category job queues cause batch synchronization jobs to starve high-priority document postings. Allocating dedicated category codes and concurrency limits prevents batch freezes.
- Modern AL Data Access: Utilizing
SetLoadFields(),ReadIsolation::ReadUncommitted, and Partial Records slashes SQL payload size by up to 90% and multiplies API throughput by 4x. - Telemetry Observability: Connecting Business Central to Azure Application Insights provides instant visibility into long-running SQL queries (RT0005), deadlocks (RT0012), and background worker thread exhaustion.
When an enterprise scales on Microsoft Dynamics 365 Business Central SaaS, performance degradation rarely announces itself politely. It arrives during peak morning order fulfillment: warehouse scanners freezing during pick confirmations, finance teams staring at spinning dials while posting sales invoices, and automated e-commerce sync jobs crashing with SQL table lock timeout errors.
In on-premises Dynamics NAV or SQL Server environments, administrators could mask architectural inefficiencies by adding RAM, upgrading NVMe drives, or spinning up extra virtual cores. In Business Central Cloud (SaaS), however, that luxury does not exist. Tenants share pooled Microsoft Azure SQL infrastructure with elastic resource governors. When an unoptimized AL customization holds a transaction open or queries unindexed SIFT buckets, Microsoft’s compute governor throttles execution, triggers deadlock rollbacks, and deprioritizes background tasks.
Through dozens of enterprise ERP remediation engagements at Allgrow Technologies, our architects have documented that over 90% of cloud performance issues stem from four specific culprits: misunderstood SQL locking semantics in AL, monolithic Job Queue configurations, heavy uncached REST/OData API integration loops, and lack of Application Insights telemetry governance.
This engineering guide outlines the exact tactical methodology our architects use to diagnose, trace, and eliminate these bottlenecks for good.
1. The Anatomy of SQL Table Locks in Business Central Cloud
In Microsoft Dynamics 365 Business Central, every business transaction maps down to Azure SQL Server database engines. When a user or automated process writes or modifies a record, the Business Central Server Service Tier (NST) places locks on rows, pages, or entire tables to guarantee ACID (Atomicity, Consistency, Isolation, Durability) compliance.
The most common locking modes encountered in Business Central include:
- Shared Locks (S): Acquired when reading data. Multiple readers can read simultaneously without interference.
- Exclusive Locks (X): Acquired when inserting, modifying, or deleting records (e.g.,
Rec.Modify(),Rec.Insert(), orRec.LockTable()). No other transaction can read or write to this locked resource until the transaction commits or aborts. - Update Locks (U): Acquired when reading data with intent to update, preventing deadlocks between concurrent readers intending to write.
- Intent Locks (IS, IX): Establish locking hierarchy to prevent parent tables from being locked concurrently.
⚠️ The Fatal AL Anti-Pattern: Extended Transaction Windows
In AL programming, an exclusive transaction lock persists until the very end of the codeunit execution or until an explicit Commit(). If custom AL code modifies an Item Ledger Entry or Sales Line, and then initiates an external HTTP web service request (via HttpClient) or presents a modal confirm dialog to the user, the database lock remains held. Every other user attempting to post a shipment or reserve inventory is blocked in a lock wait queue until Microsoft’s SQL engine throws error RT0012: The database was unable to lock table....
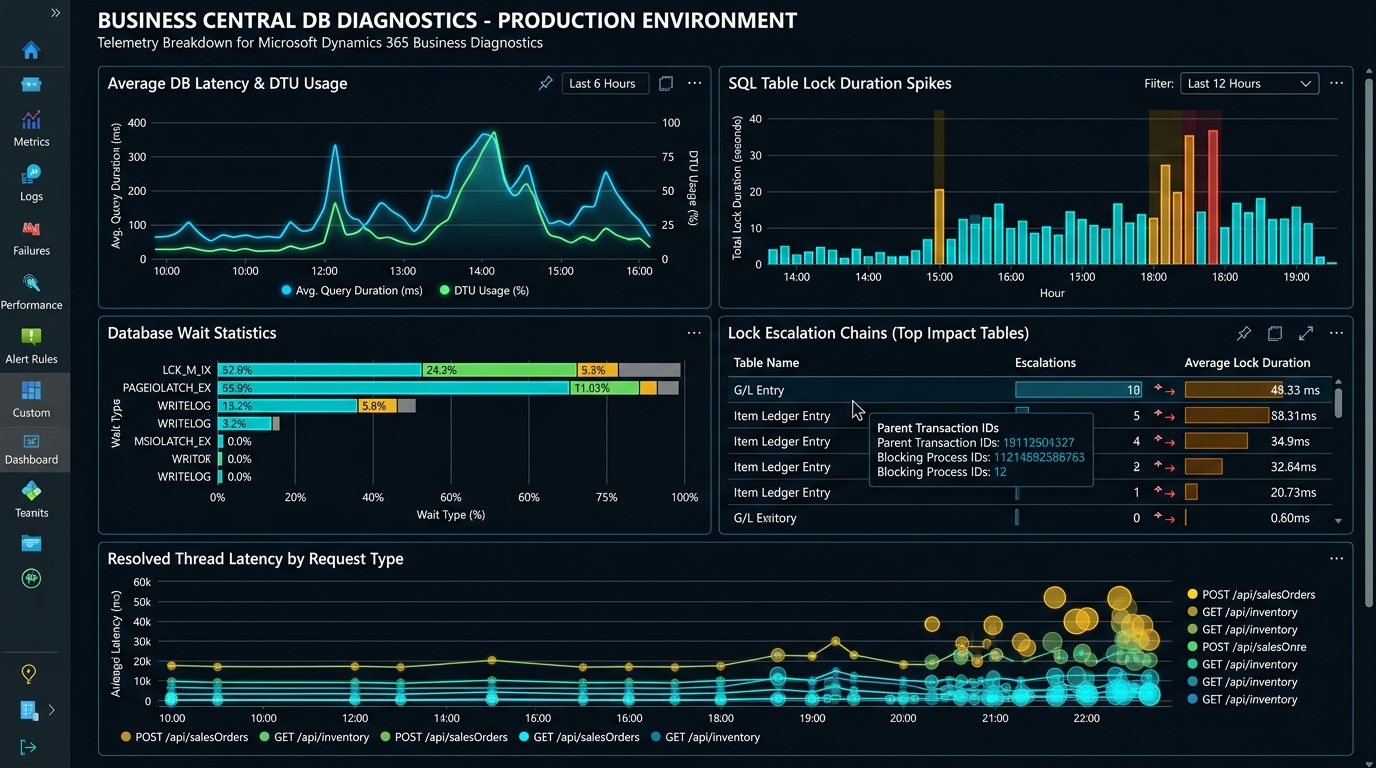
Azure Telemetry & Lock Isolation
SumIndexField Technology (SIFT) Lock Escalation
SIFT tables (such as Item Ledger Entry$0 or G/L Entry$0) maintain pre-calculated sums of quantities and amounts across inventory, customer ledgers, and general ledger accounts. While SIFT enables lightning-fast retrieval of calculated flowfields (like Item.”Inventory” or Customer.”Balance (LCY)”), it introduces heavy transactional concurrency overhead.
When multiple warehouse operators post item adjustments simultaneously, Business Central updates the underlying SIFT aggregation buckets. If multiple transactions target the same SIFT hash bucket, SQL Server escalates row-level locks to page-level or partition locks, stalling parallel posting threads.
AL Optimization: Implementing ReadIsolation and Deferral Patterns
Modern Business Central releases (BC 20 and later) introduced explicit transactional read isolation settings. Instead of defaulting to pessimistic locking during reporting or non-critical evaluations, engineers can isolate reads without blocking active postings:
// Modern High-Concurrency AL Read Isolation Pattern
procedure GetLiveStockSnapshot(ItemNo: Code[20]; LocationCode: Code[10]): Decimal
var
    ItemLedgerEntry: Record "Item Ledger Entry";
begin
    // Use ReadUncommitted for non-financial analytical lookups
    ItemLedgerEntry.ReadIsolation := IsolationLevel::ReadUncommitted;
    ItemLedgerEntry.SetCurrentKey("Item No.", "Location Code", "Posting Date");
    ItemLedgerEntry.SetRange("Item No.", ItemNo);
    ItemLedgerEntry.SetRange("Location Code", LocationCode);

    // SetLoadFields guarantees only the needed field is transferred from Azure SQL
    ItemLedgerEntry.SetLoadFields(Quantity);
    ItemLedgerEntry.CalcSums(Quantity);

    exit(ItemLedgerEntry.Quantity);
end;
2. Azure Application Insights: Tracing Long-Running Queries & Locks (RT0005 & RT0012)
You cannot optimize what you do not measure. In modern Business Central cloud operations, the primary diagnostic lens is Azure Application Insights. Business Central natively streams operational telemetry events into an Azure Log Analytics workspace.
When troubleshooting slow posting or sudden transaction timeouts, our architects focus on three specific Microsoft Telemetry Event IDs:
| Telemetry Event ID | Event Name | Diagnostic Value | Remediation Threshold |
|---|---|---|---|
| RT0005 | Long Running SQL Query | Identifies specific SQL statements exceeding execution duration thresholds. Reveals unindexed WHERE clauses, full table scans, and SIFT overhead. | Execution time > 1,000ms |
| RT0012 | SQL Lock Timeout | Captures instances where a transaction aborted because another process held a lock past the timeout window. Identifies victim and blocker object IDs. | Any occurrence in production |
| RT0018 | Job Queue Execution Failure | Tracks background tasks terminating abnormally due to deadlocks, memory exhaustion, or network disconnects. | Failure rate > 0% |
KQL Query: Finding Top 10 Blocking Objects
Run this Kusto Query Language (KQL) script in Azure Log Analytics to instantly isolate which AL objects are triggering the highest lock wait durations across your tenant:
// KQL Script: Top SQL Lock Contention Traces
traces
| where timestamp > ago(24h)
| where customDimensions.eventId == 'RT0012'
| extend alObjectId = tostring(customDimensions.alObjectId),
         alObjectName = tostring(customDimensions.alObjectName),
         alObjectType = tostring(customDimensions.alObjectType),
         sqlTableName = tostring(customDimensions.sqlTableName),
         clientType = tostring(customDimensions.clientType)
| summarize LockCount = count() by alObjectType, alObjectName, sqlTableName, clientType
| sort by LockCount desc
| take 10
3. Job Queue Optimization & Preventing Category Starvation
The Business Central Job Queue is the asynchronous engine of enterprise automation—powering automated document posting, banking feeds, inventory replenishment calculations, and EDI syncs. However, default out-of-the-box setups frequently fall victim to Job Queue Starvation.

Job Queue Architecture
The Root Cause of Job Queue Freezes
In Business Central SaaS, Microsoft allocates background worker tasks per environment. If all scheduled jobs are configured with empty or identical Job Queue Category Codes, they execute in a single shared queue thread pool.
When an overnight EDI catalog synchronization or heavy demand-planning MRP batch encounters a third-party API timeout or slow database lock, it occupies a background thread for minutes. Behind it, hundreds of mission-critical sales order posting jobs queue up in Ready status, completely stalled.
The 4-Pillar Job Queue Engineering Architecture
-
Strict Job Queue Category Isolation: Divide scheduled tasks into distinct categories:
POSTING(Sales & Purchase document release),INTEG(Shopify/EDI feeds),REPORT(Heavy data aggregation & Power BI refresh), andSYSTEM(Change log cleanup, telemetry heartbeats). - Dedicated Background Sessions: Configure maximum concurrent background sessions per category. Ensure that non-critical reporting jobs never consume more than 25% of available thread capacity.
- Exponential Backoff on Retry: Configure failed job queue entries with intelligent retry intervals (1 min, 5 min, 15 min) rather than instantaneous 1-second loops, preventing deadlocked transactions from hammering the database.
- Decoupled Outbox Design Pattern: Rather than processing integrations inline during document posting, use an asynchronous transactional outbox table. Postings write a lightweight event record in < 50ms, and a decoupled worker flow transfers data to external endpoints asynchronously.
4. Modern AL Development: Partial Records (SetLoadFields) & Memory Footprint
Prior to Business Central 2020 Release Wave 2, invoking Record.FindSet() transferred every single column defined on that table from Azure SQL into the NST server tier memory buffer. On wide tables like Sales Line (over 120 standard fields plus custom extension fields), looping over 10,000 lines generated hundreds of megabytes of unnecessary network serialization and memory consumption.
The Solution: Partial Records via SetLoadFields
Using Partial Records allows developers to specify precisely which fields the database engine must return:
// High-Efficiency Partial Records Pattern
procedure ComputeOpenInvoiceBalances(CustNo: Code[20]): Decimal
var
    CustLedgEntry: Record "Cust. Ledger Entry";
    TotalBalance: Decimal;
begin
    CustLedgEntry.SetCurrentKey("Customer No.", "Open", "Posting Date");
    CustLedgEntry.SetRange("Customer No.", CustNo);
    CustLedgEntry.SetRange(Open, true);

    // Explicitly select only the fields needed for the computation
    CustLedgEntry.SetLoadFields("Remaining Amount", "Currency Code");

    if CustLedgEntry.FindSet() then
        repeat
            TotalBalance += CustLedgEntry."Remaining Amount";
        until CustLedgEntry.Next() = 0;

    exit(TotalBalance);
end;
Avoiding Record Count Pitfalls: Use IsEmpty() Instead of FindFirst()
A pervasive anti-pattern in legacy C/AL code is evaluating whether records exist using if Record.Count() > 0 then or if Record.FindFirst() then:
Count()forces SQL Server to perform an index or table scan to compute the exact total, even if thousands of records exist.FindFirst()requests and caches the first record’s entire buffer.IsEmpty()translates to an optimized SQLIF EXISTS (SELECT 1 FROM ...)query. It returns a boolean instantly without transferring or caching any row data.
5. API Architecture & Eliminating 429 Throttling in Omnichannel Integrations
Modern mid-market enterprises integrate Business Central with multi-vendor marketplaces, Shopify Plus stores, warehouse management systems (WMS), and Salesforce/Dynamics CRM. If integration middleware makes chatty, single-record REST calls, the system quickly hits Microsoft’s cloud API governance barriers:
| Governance Dimension | Business Central SaaS Cloud Limit | Impact of Violation |
|---|---|---|
| Request Rate Limit | 600 requests per minute per environment | HTTP 429 “Too Many Requests” with Retry-After header |
| Concurrent Requests | 100 concurrent requests per environment | Immediate rejection of incoming traffic |
| Execution Timeout | 6 minutes per web service call | Hard thread kill with database rollback |
| Payload Size Limit | 350 MB per request | HTTP 413 “Payload Too Large” |
Architecture Shift: From Chatty OData to Batch APIs & Deep Inserts
To ingest orders at enterprise scale, eliminate individual REST calls for the header and each line item. A 50-line sales order created via standard OData requires 51 separate HTTP roundtrips. Under high volume, this rapidly exhausts the 600 req/min limit.
Instead, architect integrations around two high-throughput patterns:
-
Deep Insert API Pages: Define custom API pages with nested part lines (e.g.,
linesentity linked via parent-child relationship). This allows creating the entire sales header and all 50 line items in a single atomic HTTP POST request. -
Batch Requests (
$batch): Bundle up to 100 operations into a single multipart OData request. Business Central executes them within a single connection context, minimizing handshake latency and eliminating HTTP header overhead.
For complex multi-channel architectures, review our deep dive on Business Central 29 EDI & Shopify API Architecture and explore our Enterprise Data Integration Practice.
6. The 7-Point Enterprise Performance Tuning Audit Framework
Before releasing new AL customizations or rolling out major warehouse expansions, execute this comprehensive audit checklist developed by our engineering team:
Pre-Release Performance Verification Protocol
- 1. Audit LockTable() Placements: Search all AL code repositories for
LockTable()calls. Ensure no web service calls, user dialogs, or heavy loops occur after a lock is acquired. - 2. Enforce SetLoadFields Across Loops: Verify that every
FindSet()on high-volume tables (G/L Entry, Item Ledger Entry, Sales Line, Customer Ledger Entry) specifies explicit fields. - 3. Implement SIFT & Custom Secondary Keys: Ensure every custom filter applied in report request pages or API queries is backed by an active AL table key.
- 4. Isolate Job Queue Category Codes: Verify that posting, EDI, and night maintenance jobs run in isolated categories with appropriate recurrence intervals.
- 5. Enable Background Document Posting: Turn on background posting in Sales & Receivables and Purchases & Payables setup to free up user threads.
- 6. Configure Azure Application Insights Telemetry: Verify Event IDs RT0005, RT0012, and RT0018 are streaming with automated alert thresholds.
- 7. Pre-Wave 1 & Wave 2 Regression Testing: Run automated performance tests in an isolated sandbox before Microsoft pushes semi-annual platform updates.
⚡ Enterprise Performance Optimization Practice
Is SQL Lock Contention or Job Queue Latency Impacting Your Operations?
Allgrow Technologies provides comprehensive Business Central telemetry audits, AL code refactoring, and 24/7 SLA-backed managed support. Our senior ERP architects analyze your Application Insights telemetry, optimize data structures, and eliminate table locks without disrupting live commerce.
Frequently Asked Questions
What causes SQL table lock timeouts (Event RT0012) in Business Central SaaS?
How does Partial Records (SetLoadFields) improve cloud performance?
FindSet() fetches all columns from SQL Server across the network. Many Business Central tables have 100+ columns. When evaluating large datasets, this generates massive network transfer and memory overhead. SetLoadFields tells SQL Server to select only the specified columns. In testing across millions of records, partial records reduces data transfer by up to 90% and cuts execution duration by over 60%.
Can Allgrow Technologies help audit our custom Business Central extensions?
How do we prevent API 429 throttling during high-volume order ingestion?
Retry-After HTTP response header.