Executive Dashboards
Monitor financial performance, revenue, profitability, cash flow, operational KPIs, and strategic business metrics from a single executive dashboard.
Microsoft Business Intelligence
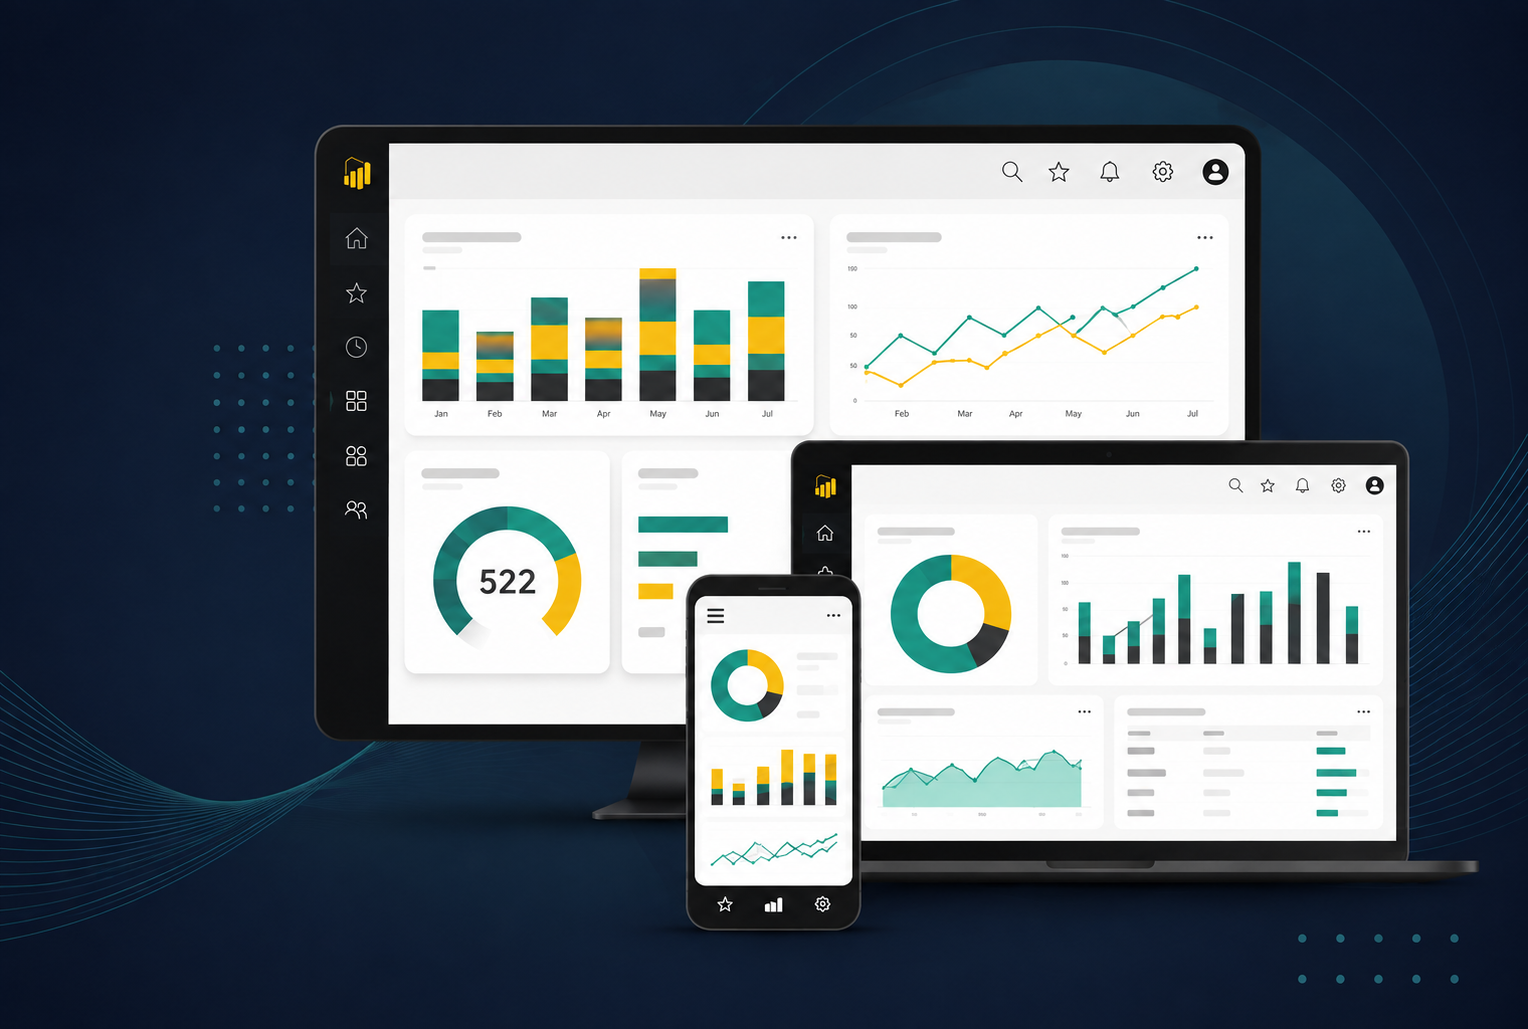
Organizations generate vast amounts of business data every day, but data alone doesn't drive growth - insights do. Microsoft Power BI transforms information from ERP, CRM, finance, manufacturing, operations, and cloud applications into interactive dashboards that help leaders monitor performance, identify trends, and make confident business decisions in real time.
The case for change
Many organizations rely on spreadsheets, static reports, and disconnected data sources to understand business performance. Teams spend valuable time collecting information from multiple systems instead of analyzing it, while executives often make decisions using outdated reports. Without centralized reporting, organizations struggle to monitor profitability, sales performance, inventory, operations, customer trends, and financial health across departments. Modern businesses require real-time business intelligence built on trusted enterprise data.
One question, four different answers
When the numbers disagree, the meeting is spent reconciling them instead of acting on them.
Many sources, one agreed set of numbers
Our Solution
Our Microsoft Power BI solutions consolidate data from Microsoft Dynamics 365 Business Central, Dynamics 365 CRM, Microsoft Fabric, Azure, SQL Server, Excel, SharePoint, Dataverse, and third-party applications into interactive dashboards that provide real-time visibility across the enterprise. Rather than producing static reports, we build intelligent analytics platforms that enable leadership teams to monitor KPIs, drill into business performance, identify opportunities, and make faster, data-driven decisions.
What we build, from a first executive dashboard to analytics running across the whole business.
Monitor financial performance, revenue, profitability, cash flow, operational KPIs, and strategic business metrics from a single executive dashboard.
Connect Microsoft Dynamics 365 Business Central with Power BI to visualize finance, inventory, purchasing, sales, manufacturing, warehousing, and operational performance.
Track pipeline performance, customer acquisition, sales forecasting, revenue growth, customer profitability, and service performance using connected CRM and ERP data.
Analyze procurement, manufacturing, inventory turnover, warehouse efficiency, project performance, and supply chain operations with real-time reporting.
Leverage AI visuals, forecasting, anomaly detection, trend analysis, and natural language queries to uncover hidden business opportunities.
Connect Power BI with Microsoft Fabric, Azure, SQL Server, Dataverse, SharePoint, Excel, REST APIs, cloud services, and third-party enterprise applications.
Power BI in action
A manufacturing company operates Business Central for ERP, Dynamics 365 Sales for CRM, multiple warehouse locations, and several production facilities. Previously, every department produced separate reports, resulting in inconsistent data and delayed executive decision-making. By implementing Microsoft Power BI, data from every business system is consolidated into interactive dashboards that provide live visibility into sales, production, procurement, inventory, financial performance, and customer operations. Executives can drill into individual business units, identify operational bottlenecks, and make strategic decisions using real-time business intelligence rather than month-end reports.
Every department, on the same report page
Feeding this page
Drive business growth with trusted, real-time analytics.
Access live dashboards that reflect current business performance instead of relying on static reports.
Consolidate ERP, CRM, finance, operations, and external systems into a unified reporting platform.
Monitor KPIs across finance, sales, operations, inventory, procurement, manufacturing, and customer service.
Automate report generation and eliminate spreadsheet-driven reporting processes.
Use predictive insights, forecasting, anomaly detection, and intelligent visualizations to support strategic planning.
Build a reporting platform capable of supporting growing business operations, additional data sources, and future analytics initiatives.
Why Allgrow
At Allgrow, we design Power BI solutions that go beyond dashboards. We connect Microsoft Dynamics 365, Business Central, Microsoft Fabric, Azure, Dataverse, and enterprise applications into a unified analytics platform that delivers trusted, real-time business intelligence.
Our focus is on helping organizations measure what matters, identify growth opportunities, improve operational visibility, and create a scalable reporting environment that evolves with the business.
Questions
Microsoft Power BI is Microsoft's business intelligence platform that transforms data from multiple sources into interactive dashboards, reports, and real-time analytics.
Yes. Power BI integrates natively with Microsoft Dynamics 365 Business Central, providing live insights into finance, inventory, procurement, manufacturing, sales, and operational performance.
Power BI connects to Microsoft Fabric, Azure, SQL Server, Dataverse, SharePoint, Excel, Dynamics 365, Business Central, Oracle, Salesforce, SAP, REST APIs, cloud databases, and hundreds of other data sources.
Yes. Dashboards can refresh automatically and display real-time operational information depending on the connected data sources and architecture.
Yes. Power BI includes AI-powered forecasting, anomaly detection, natural language queries, smart narratives, and advanced analytics that help organizations discover meaningful business insights.
Absolutely. Power BI supports enterprise-scale reporting with role-based security, governance, row-level security, shared semantic models, and integration with Microsoft Fabric.
Power BI is Microsoft's visualization and reporting platform, while Microsoft Fabric provides the complete enterprise analytics foundation - including data engineering, data warehousing, governance, and analytics - with Power BI as its reporting layer.
Yes. We provide Power BI consulting, dashboard development, Business Central integration, Microsoft Fabric implementation, enterprise analytics architecture, governance, optimization, and ongoing support.
Keep exploring
Next step
At Allgrow, we design Power BI solutions that go beyond dashboards. We connect Microsoft Dynamics 365, Business Central, Microsoft Fabric, Azure, Dataverse, and enterprise applications into a unified analytics platform that delivers trusted, real-time business intelligence. Our focus is on helping organizations measure what matters, identify growth opportunities, improve operational visibility, and create a scalable reporting environment that evolves with the business.
Focused consultation